Baylee Froerer

Redefining Event Analytics
Why this matters: I took a poorly understood, underperforming product area with no personas, analytics, or clear problem definition and transformed it into a client-validated, adoption-driving analytics experience through research-led design and close engineering collaboration.
Overview

Rainfocus
Problem Statement & Summary:
When I joined RainFocus, the Dashboard Analytics product was generating strong client dissatisfaction but lacked clear ownership, defined personas, or measurable success metrics. The team couldn’t answer who the product was for, how it was being used, or what problems to solve first. My goal was to lead discovery, establish shared clarity across product and engineering, and design scalable improvements that aligned user needs with RainFocus’s business promise of being a single source of truth for event analytics.
Team:
- Product designer (me)
- Product Manager
- Developer Architect
- 1 backend developer
- 2 front end developers
- UI developer
- QA
- Internal Business Analytics team
Timeline:
~6 - 12 months (Discovery → shipped solution)

SaAs

Analytics Tool

B2B
Discovery Phase

Product Goals:
- Establish clarity between product and engineering
- Reduce manual build effort from internal CS teams
- Design scalable improvements that aligned user needs with company’s business promise of being a single source of truth for event analytics
- Reduce outside feature work to complete internal feature tasks
Project Constraints:
- Limited historical data for existing dashboard system
- No defined pain points, personas, measurable success metrics
- No defined client users lists
- Changing Product manager
- Limited internal business experience conducting user research
I led end-to-end discovery in an environment with no existing product analytics or user research practice. Partnering with Business Analytics, I analyzed dashboard usage across 29 client organizations, identifying top users based on time-in-feature and segmenting them into low, medium, and power users within each organizations top 5 users. I conducted qualitative discovery interviews across 17 organizations, combining usage data, job roles, and behavioral patterns to uncover who was using dashboards, why they relied on them, and where the experience broke down.
Team Alignment

I synthesized findings into two core personas and a prioritized problem space, then presented insights to the full product team to create a shared understanding of users, pain points, and opportunities. This work aligned a transitioning product team around clear ownership and direction, established trust in UX-led discovery, and created a common language for decision-making. I also partnered closely with engineering to deeply understand RainFocus’s data architecture and ensure design solutions were feasible within complex backend constraints.
Team Whiteboard Session (Architect Developer, UX, PM)
Design Iteration & Prototypes

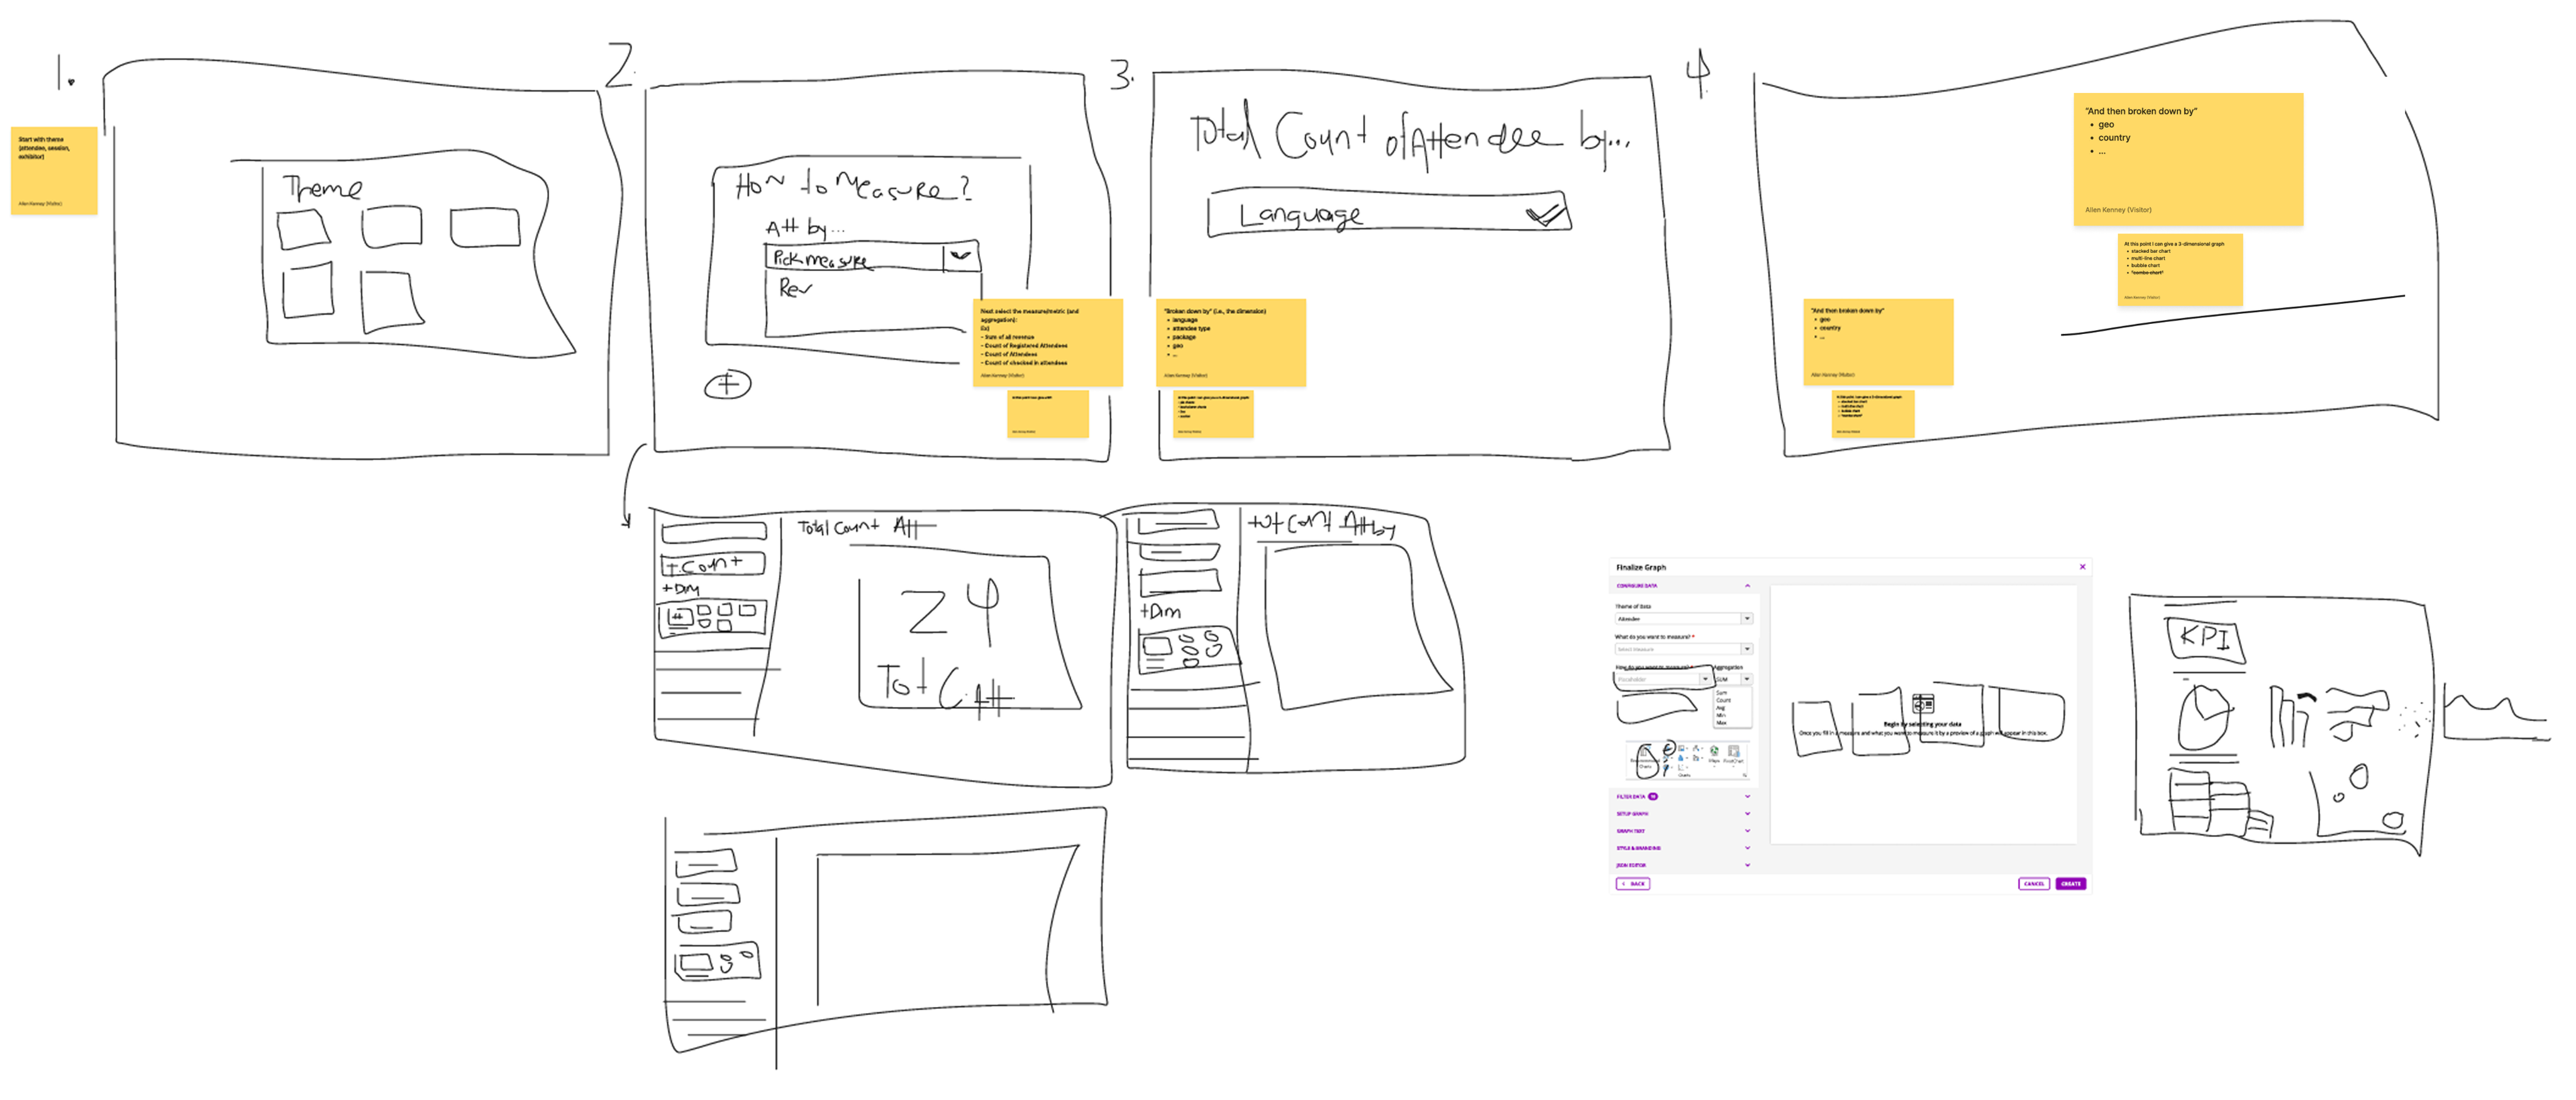
Based on discovery, I led design iterations focused on improving dashboard discoverability, reducing setup complexity, and enabling faster insight generation. Key solutions included dashboard previews for faster navigation, reusable dashboard templates, richer layout and annotation tools, and a redesigned dashboard builder that allowed users to create simple data visualizations without first building full reports. I worked closely with frontend, UI, and backend engineers to design a simplified UI that abstracted complex data logic while preserving analytical power.
User Testing & Findings

I validated designs through iterative feedback with clients and internal stakeholders, focusing on clarity, efficiency, and confidence when building dashboards. Testing confirmed that enabling in-context aggregation, chart previews, and data filtering dramatically reduced reliance on Customer Success and lowered the barrier to self-serve analytics. Post-deployment, the product saw a 9%+ month-over-month increase in new dashboard user adoption, indicating improved usability and perceived value.
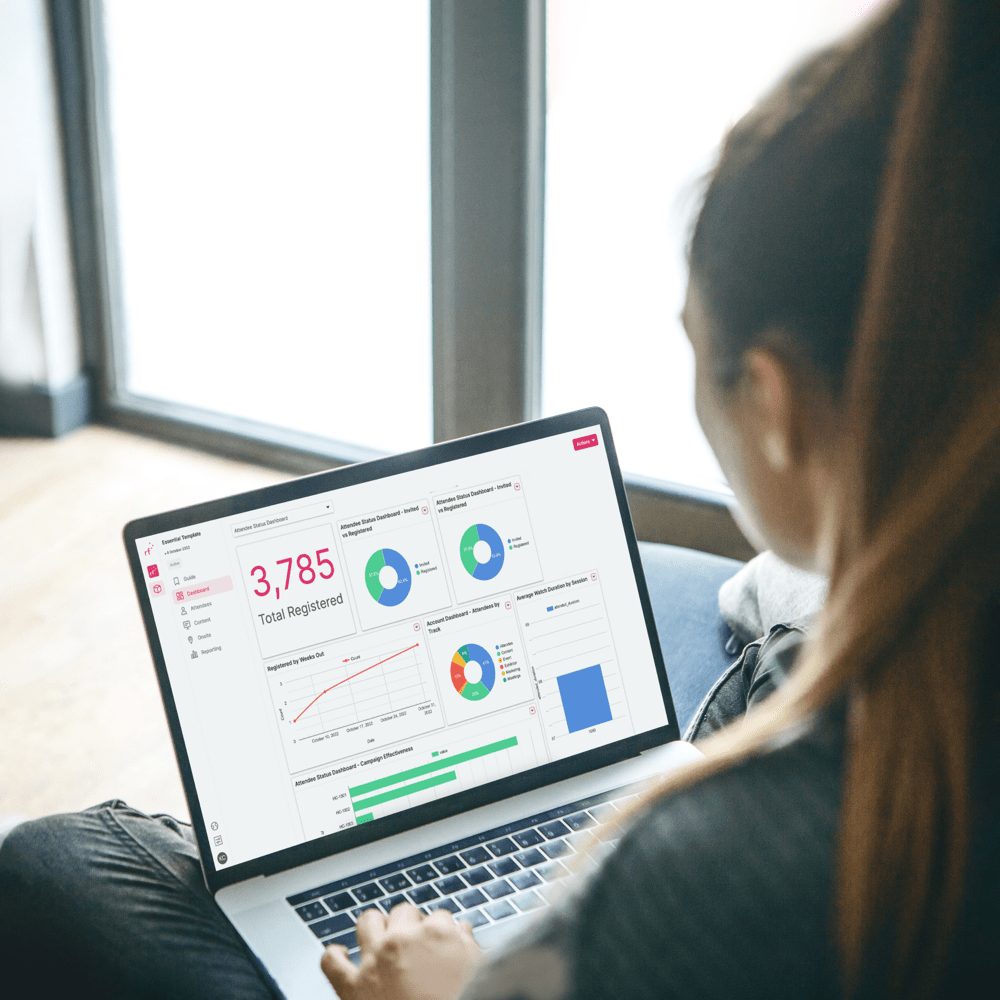
Old Dashboard Experience
New Dashboard Experience
Conclusion

This project established foundational personas, workflows, and UX patterns for RainFocus analytics and proved the value of research-driven design within the organization. Beyond shipped improvements, it created a scalable framework for future dashboard capabilities, including recommendations, year-over-year analytics, and deeper personalization. As the sole UX designer, I drove clarity from ambiguity, aligned cross-functional teams, and delivered enterprise-ready solutions that balanced user needs, technical complexity, and business goals.
©Baylee Froerer
• 2026 • Remade far too many times to count
Baylee Froerer

Redefining Event Analytics
Why this matters: I took a poorly understood, underperforming product area with no personas, analytics, or clear problem definition and transformed it into a client-validated, adoption-driving analytics experience through research-led design and close engineering collaboration.
Overview

Rainfocus
Problem Statement & Summary:
When I joined RainFocus, the Dashboard Analytics product was generating strong client dissatisfaction but lacked clear ownership, defined personas, or measurable success metrics. The team couldn’t answer who the product was for, how it was being used, or what problems to solve first. My goal was to lead discovery, establish shared clarity across product and engineering, and design scalable improvements that aligned user needs with RainFocus’s business promise of being a single source of truth for event analytics.
Team:
- Product designer (me)
- Product Manager
- Developer Architect
- 1 backend developer
- 2 front end developers
- UI developer
- QA
- Internal Business Analytics team
Timeline:
~6 - 12 months (Discovery → shipped solution)

SaAs

Analytics Tool

B2B
Discovery Phase

Product Goals:
- Establish clarity between product and engineering
- Reduce manual build effort from internal CS teams
- Design scalable improvements that aligned user needs with company’s business promise of being a single source of truth for event analytics
- Reduce outside feature work to complete internal feature tasks
Project Constraints:
- Limited historical data for existing dashboard system
- No defined pain points, personas, measurable success metrics
- No defined client users lists
- Changing Product manager
- Limited internal business experience conducting user research
I led end-to-end discovery in an environment with no existing product analytics or user research practice. Partnering with Business Analytics, I analyzed dashboard usage across 29 client organizations, identifying top users based on time-in-feature and segmenting them into low, medium, and power users within each organizations top 5 users. I conducted qualitative discovery interviews across 17 organizations, combining usage data, job roles, and behavioral patterns to uncover who was using dashboards, why they relied on them, and where the experience broke down.
Team Alignment

I synthesized findings into two core personas and a prioritized problem space, then presented insights to the full product team to create a shared understanding of users, pain points, and opportunities. This work aligned a transitioning product team around clear ownership and direction, established trust in UX-led discovery, and created a common language for decision-making. I also partnered closely with engineering to deeply understand RainFocus’s data architecture and ensure design solutions were feasible within complex backend constraints.
Team Whiteboard Session (Architect Developer, UX, PM)
Design Iteration & Prototypes

Based on discovery, I led design iterations focused on improving dashboard discoverability, reducing setup complexity, and enabling faster insight generation. Key solutions included dashboard previews for faster navigation, reusable dashboard templates, richer layout and annotation tools, and a redesigned dashboard builder that allowed users to create simple data visualizations without first building full reports. I worked closely with frontend, UI, and backend engineers to design a simplified UI that abstracted complex data logic while preserving analytical power.
User Testing & Findings

I validated designs through iterative feedback with clients and internal stakeholders, focusing on clarity, efficiency, and confidence when building dashboards. Testing confirmed that enabling in-context aggregation, chart previews, and data filtering dramatically reduced reliance on Customer Success and lowered the barrier to self-serve analytics. Post-deployment, the product saw a 9%+ month-over-month increase in new dashboard user adoption, indicating improved usability and perceived value.
Old Dashboard Experience
New Dashboard Experience
Conclusion

This project established foundational personas, workflows, and UX patterns for RainFocus analytics and proved the value of research-driven design within the organization. Beyond shipped improvements, it created a scalable framework for future dashboard capabilities, including recommendations, year-over-year analytics, and deeper personalization. As the sole UX designer, I drove clarity from ambiguity, aligned cross-functional teams, and delivered enterprise-ready solutions that balanced user needs, technical complexity, and business goals.
©Baylee Froerer
• 2026 • Remade far too many times to count

Baylee Froerer

Redefining Event Analytics
Why this matters: I took a poorly understood, underperforming product area with no personas, analytics, or clear problem definition and transformed it into a client-validated, adoption-driving analytics experience through research-led design and close engineering collaboration.
Overview

Rainfocus
Problem Statement & Summary:
When I joined RainFocus, the Dashboard Analytics product was generating strong client dissatisfaction but lacked clear ownership, defined personas, or measurable success metrics. The team couldn’t answer who the product was for, how it was being used, or what problems to solve first. My goal was to lead discovery, establish shared clarity across product and engineering, and design scalable improvements that aligned user needs with RainFocus’s business promise of being a single source of truth for event analytics.
Team:
- Product designer (me)
- Product Manager
- Developer Architect
- 1 backend developer
- 2 front end developers
- UI developer
- QA
- Internal Business Analytics team
Timeline:
~6 - 12 months (Discovery → shipped solution)
SaAs
Analytics Tool
B2B
Discovery Phase

Product Goals:
- Establish clarity between product and engineering
- Reduce manual build effort from internal CS teams
- Design scalable improvements that aligned user needs with company’s business promise of being a single source of truth for event analytics
- Reduce outside feature work to complete internal feature tasks
Project Constraints:
- Limited historical data for existing dashboard system
- No defined pain points, personas, measurable success metrics
- No defined client users lists
- Changing Product manager
- Limited internal business experience conducting user research
I led end-to-end discovery in an environment with no existing product analytics or user research practice. Partnering with Business Analytics, I analyzed dashboard usage across 29 client organizations, identifying top users based on time-in-feature and segmenting them into low, medium, and power users within each organizations top 5 users. I conducted qualitative discovery interviews across 17 organizations, combining usage data, job roles, and behavioral patterns to uncover who was using dashboards, why they relied on them, and where the experience broke down.
Team Alignment

I synthesized findings into two core personas and a prioritized problem space, then presented insights to the full product team to create a shared understanding of users, pain points, and opportunities. This work aligned a transitioning product team around clear ownership and direction, established trust in UX-led discovery, and created a common language for decision-making. I also partnered closely with engineering to deeply understand RainFocus’s data architecture and ensure design solutions were feasible within complex backend constraints.
Team Whiteboard Session (Architect Developer, UX, PM)
Design Iteration & Prototypes

Based on discovery, I led design iterations focused on improving dashboard discoverability, reducing setup complexity, and enabling faster insight generation. Key solutions included dashboard previews for faster navigation, reusable dashboard templates, richer layout and annotation tools, and a redesigned dashboard builder that allowed users to create simple data visualizations without first building full reports. I worked closely with frontend, UI, and backend engineers to design a simplified UI that abstracted complex data logic while preserving analytical power.
User Testing & Findings

I validated designs through iterative feedback with clients and internal stakeholders, focusing on clarity, efficiency, and confidence when building dashboards. Testing confirmed that enabling in-context aggregation, chart previews, and data filtering dramatically reduced reliance on Customer Success and lowered the barrier to self-serve analytics. Post-deployment, the product saw a 9%+ month-over-month increase in new dashboard user adoption, indicating improved usability and perceived value.
Old Dashboard Experience
New Dashboard Experience
Conclusion

This project established foundational personas, workflows, and UX patterns for RainFocus analytics and proved the value of research-driven design within the organization. Beyond shipped improvements, it created a scalable framework for future dashboard capabilities, including recommendations, year-over-year analytics, and deeper personalization. As the sole UX designer, I drove clarity from ambiguity, aligned cross-functional teams, and delivered enterprise-ready solutions that balanced user needs, technical complexity, and business goals.
©Baylee Froerer
• 2026 • Remade far too many times to count